Hi traders!
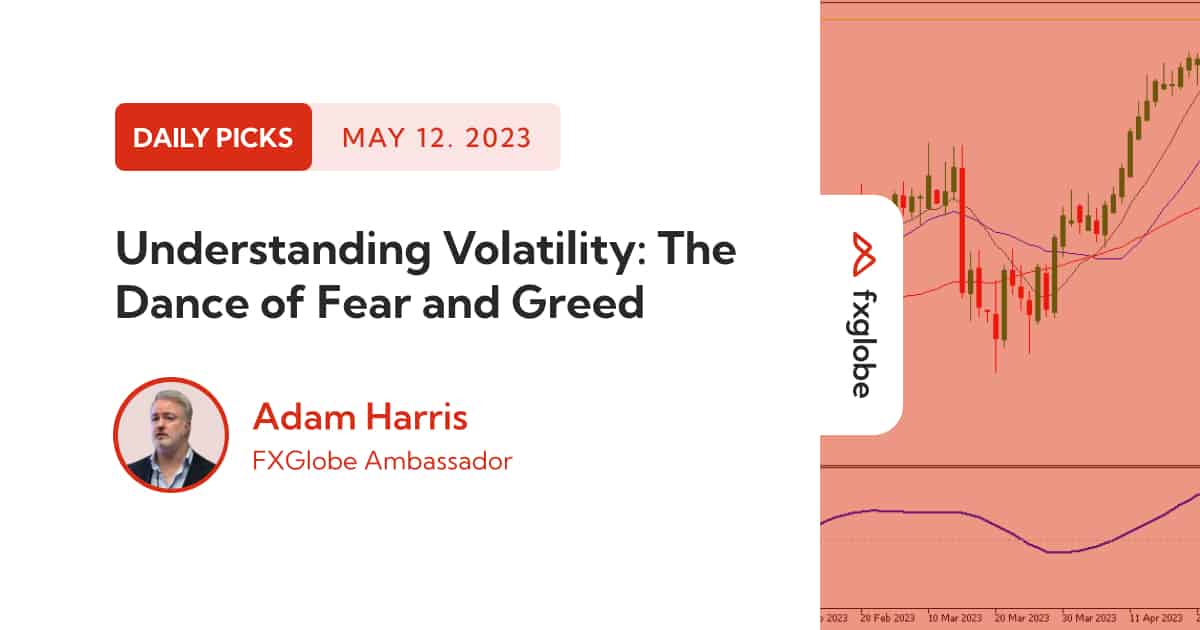
In the world of trading, volatility is a term that’s thrown around quite often. It’s the measure of price variations over a specified period of time. It can be your best friend or your worst enemy, depending on how you approach it. Today, let’s dive into the concept of ‘good’ and ‘bad’ volatility and how fear and greed play into this.
The market is a reflection of collective human behaviour. The two most potent emotional forces that drive this behaviour in the markets are fear and greed. Fear can lead to sudden sell-offs, while greed can cause price spikes as traders rush to buy. This results in volatility, which creates opportunities for profit – and this is what we call ‘good’ volatility.
‘Good’ volatility is characterized by high liquidity, clear trend direction, and manageable price swings. These conditions allow traders to enter and exit trades more efficiently and potentially profit from price movements.
However, not all volatility is good. ‘Bad’ volatility, often seen during times of economic uncertainty or unexpected news events, can lead to erratic and unpredictable price movements. This can make it challenging to execute trades and maintain a steady trading strategy.
One pattern traders often observe is a period of sluggish market activity followed by sudden, active moves. This can be a sign of an impending significant price movement. During these quieter periods, it’s crucial to stay alert and prepare for potential rapid shifts in market volatility.
Understanding and navigating volatility is a crucial skill for traders. By focusing on ‘good’ volatility periods and being cautious during ‘bad’ volatility, traders can better manage their risk and take advantage of the opportunities that market fluctuations provide.
Remember, volatility isn’t something to fear, but rather a reality to embrace and understand in the trading landscape. So, let’s keep calm and trade on!
Sidenote: Using ATR to Navigate Volatility
Many traders use the Average True Range (ATR) indicator as a tool to help them navigate through volatility. ATR measures market volatility by decomposing the entire range of an asset price for that period, giving traders an understanding of the degree of price volatility.
Traders often use ATR to establish stop-loss levels that are appropriate for the current volatility. By doing so, they aim to prevent being prematurely stopped out of a trade due to normal market fluctuations.
However, while ATR can be a handy tool, it’s important to understand its limitations. The ATR indicator is backward-looking, meaning it only takes into account recent volatility. It does not and cannot predict sudden increases in volatility due to unforeseen events or data releases.
That’s why relying solely on ATR for stop-loss placement may not always yield the desired results. It’s crucial to also consider key price levels on higher timeframes and other market information. Unexpected volatility can significantly affect price movements, and being aware of key resistance and support levels can provide an additional layer of protection against such market shifts.
Happy Trading!

